SoundAnalyzer
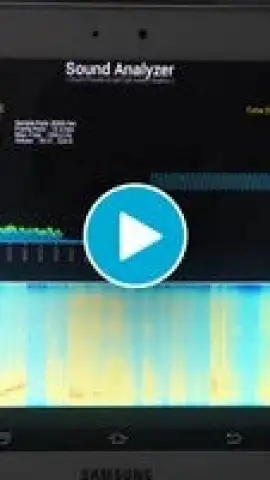
SoundAnalyzer screenshots (1)
Description SoundAnalyzer
The Quiet Observer: A Tool for Seeing Sound
There is a world of information hidden within the vibrations we call sound, a landscape of frequency and amplitude that our ears can only partially interpret. For years, accessing this data required specialized, expensive hardware. Now, imagine having a portable laboratory in your pocket, capable of rendering the invisible architecture of any noise—from a violin's resonance to the rumble of a passing train—into precise, visual data. This is the core proposition of SoundAnalyzer by TiniaSoft, an Android application that transforms your smartphone or tablet into a sophisticated audio analysis suite. It moves beyond simple recording, offering a window into the temporal and spectral dimensions of sound, making it a compelling instrument for the curious hobbyist, the troubleshooting musician, and the methodical engineer alike.
A Triad of Analytical Perspectives
SoundAnalyzer’s power lies in its multi-pane visualization system, which allows for concurrent, real-time analysis from three distinct angles. The oscilloscope panel provides the classic time-domain view, graphing sound pressure against time to show you the raw waveform. This is essential for observing amplitude envelopes, transients, and the fundamental shape of a sound. Simultaneously, the spectrum analyzer panel displays the instant frequency-domain data, breaking down the complex waveform into its constituent frequencies and their respective power. For a more cumulative and historical view, the spectrogram panel plots frequency against time using a color gradient to represent intensity, creating a waterfall display that reveals how the spectral content evolves. The ability to freeze any display for a detailed screenshot turns casual observation into a formal documentation process, perfect for comparative analysis or reporting.
Precision Engineering Beneath a Streamlined Interface
While the visual output is comprehensive, the application’s utility is defined by its granular control. Users are not locked into a single capture quality; they can select from a range of sampling rates, from 8,000 Hz to 48,000 Hz, balancing detail against device performance for each unique scenario. The advanced frequency estimation algorithm is a standout, designed to pinpoint peak frequencies with high accuracy, which is critical for tasks like instrument tuning or identifying resonant frequencies in mechanical systems. On the spectrum panel, you can choose to display values for the single strongest frequency or the top five, and toggle between linear and logarithmic magnitude scales to best suit the analysis—whether you're examining the harmonic series of a note or the broad noise floor of an environment. Despite this depth, navigation remains intuitive, with a clear hierarchy that prevents beginners from feeling overwhelmed while giving experts quick access to advanced settings.
- Offers three simultaneous visualization panels: oscilloscope, real-time spectrum analyzer, and cumulative spectrogram for full-spectrum analysis.
- Provides adjustable audio sampling rates from 8 kHz to 48 kHz for tailored capture fidelity and performance.
- Features a specialized peak-frequency detection algorithm for highly accurate identification of dominant tones.
- Allows display freezing and screenshot capture for detailed documentation and offline review of audio events.
- Presents a clean, ad-free interface with privacy-conscious audio processing that does not record or store samples.
Start mapping the acoustic world around you with precision. Download SoundAnalyzer now and transform your device into a professional-grade audio lab.
Heads up: you'll need wifi for initial app functionality. The advanced Turbo features for enhanced resolution and export are part of a premium upgrade.


